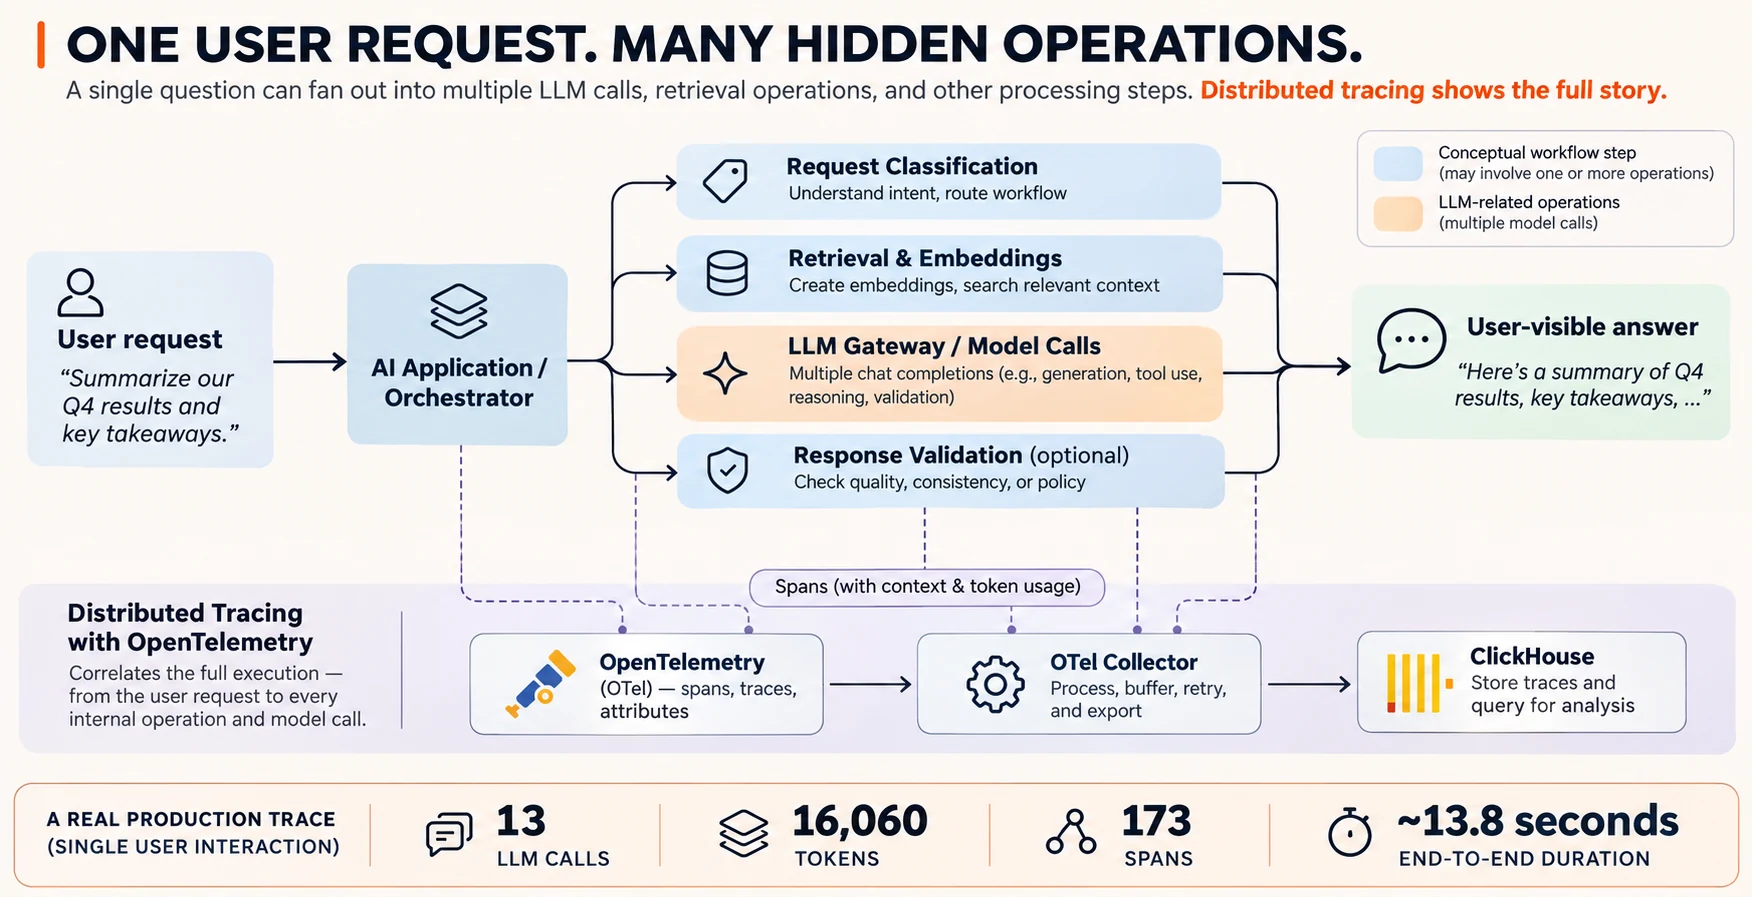
One user interaction. Thirteen LLM calls. 16,060 tokens. 173 spans.
To the user, it looked like one request.
Behind the interface, however, that request expanded into multiple chat completions, embedding calls, retrieval operations, and downstream processing. The total model cost was only a few cents, but the dollar amount was not the interesting part. The interesting part was that a simple token counter could tell us how much the system consumed without explaining why it consumed it.
That distinction matters as enterprises move from simple prompt-response applications toward agentic AI systems.
An AI agent may classify a request, retrieve context, generate embeddings, invoke tools, route between models, call another model for validation, and perform additional processing before returning a single answer. The user sees one interaction. The infrastructure sees a distributed workflow.
In one production trace I examined, that workflow generated 13 separate LLM calls, 16,060 tokens and 173 spans in roughly 13.8 seconds. Another user action produced 681 spans across four services and ran for roughly 140 seconds end to end.
This is why the next challenge in AI cost management is not simply counting tokens.
It is explaining where they went.
01 One Prompt Is No Longer One Model Call
Traditional LLM monitoring often begins with three numbers: input tokens, output tokens and total cost.
Those numbers are useful, but they represent the end of the story rather than the beginning.
A modern AI application may sit behind an architecture that looks more like this:
The work behind a single AI response
An orchestrator coordinates context retrieval, tool use, and model calls—while tracing connects the steps into one transaction.
One interaction. Thirteen model calls.
The answer is a single output; the work behind it is not.
Application, tools and model activity in one trace
At the same time, each of those components can emit telemetry into a shared observability pipeline.
OpenTelemetry makes it possible to correlate these pieces using traces, spans and attributes. Generative AI telemetry can include fields such as gen_ai.usage.prompt_tokens, gen_ai.usage.completion_tokens, gen_ai.usage.total_tokens and gen_ai.request.model, allowing model usage to become part of a broader execution trace rather than an isolated billing record.
That changes the questions engineering teams can ask.
Instead of only asking, “How many tokens did Model X use today?” teams can begin asking: Which user triggered those tokens? Which workflow caused them? How many separate model calls occurred? Which model consumed the most? Did embeddings contribute materially? Where was latency introduced? Was the expensive call necessary, or was it the result of hidden internal fan-out?
A provider dashboard can tell you consumption. A distributed trace can tell you causality.
Accounting vs. causality
Two very different ways to understand the same AI bill.
“How much did we use?”
A total across all requests: valuable for billing, but often detached from the specific workflow.
triggering_steps: unknown
root_cause: unknown
“What caused the usage?”
Correlate the initiating request, user context, tools, model calls and latency.
total_spans: 173
request_duration: ~13.8s
Two requests, very different execution footprints
Separate observed interactions; each metric has its own scale.
Tracing spans (count)
End-to-end duration (seconds)
02 Token Attribution Is an Architecture Problem
Even complete token counts do not automatically tell you who caused the cost.
In the system I worked with, the LLM gateway operated at a broader application or team level. That was sufficient to identify which application was consuming AI resources, but not which individual user inside that application generated a particular request.
Getting user-level attribution onto LLM telemetry became a separate engineering problem.
The first solution was straightforward: pass user identity explicitly through function parameters until the value eventually reached the model call.
That approach became fragile as the system expanded.
Some internal components used shared wrappers. Others invoked model-related functionality through different routes. Over time, at least 10 separate call sites across two services required individual fixes because user identity was not being propagated consistently.
The more durable solution was architectural.
Instead of manually threading identity through every function signature, user context could be established once at the authenticated request boundary and stored in a request-scoped context available to downstream operations.
Stop hand-carrying identity across every function
Pass user ID at each call
↓ function_a(user_id)
↓ helper_b(user_id)
↓ model_call(user_id?)
One forgotten parameter can disconnect usage from the person who triggered it.
Establish trusted request context
↓ set request context
↓ operations inherit context
↓ model span: user_key
Use stable, pseudonymous identifiers; avoid raw personal details on spans.
That design changes the problem from “Did every developer remember to forward the user ID?” to “Was the correct identity established when the request entered the system?”
For agentic systems, user, tenant and workflow context should behave like trace context: established at a trusted boundary and propagated systematically.
There is also an important privacy implication. Attribution does not mean telemetry should become a repository for raw personally identifiable information. A better design is often to use a stable pseudonymous identifier that remains useful for analysis without unnecessarily placing emails or other sensitive data directly onto spans. The system reviewed here demonstrated why that distinction deserves deliberate architectural attention.
03 Then We Learned the Telemetry Could Be Wrong
There is an even more uncomfortable problem.
What if the system responsible for measuring token consumption is itself losing data?
During one diagnostic investigation, token metrics in the observability layer were compared against usage recorded by the LLM gateway. The analysis documented an average match of approximately 91.5% during the measured window, with one day falling to 80.1%. That figure came from the engineering diagnostic, rather than an independently reproduced long-term benchmark, but the discrepancy was large enough to trigger a root-cause investigation.
How closely did telemetry match the gateway?
Reported diagnostic match rates from the measured window.
Diagnostic average in the observed period
One observed day in the same investigation
The primary problem was surprisingly simple.
The OpenTelemetry Collector contained a processor that discarded spans when end_time was zero.
That assumption seems reasonable for traditional synchronous telemetry: if a span has not ended, perhaps it is incomplete.
Streaming LLM responses break that assumption.
A streaming completion can emit telemetry before the stream has fully closed, meaning a zero end time may represent a legitimate intermediate state. The filter therefore discarded valid streaming LLM spans.
Worse, the pipeline was configured so the behavior happened silently.
The span-dropping filter, before and after
The record still represents an operation even if its telemetry is discarded.
Before A valid record disappears
After Stop that unnecessary rejection
The application continued working. The models continued returning answers. The provider continued recording usage. The observability system simply saw less activity than actually occurred.
That leads to a lesson I think every AI platform team should remember: A broken telemetry pipeline does not always look broken. Sometimes it simply makes your AI system look cheaper than it really is.
04 Your Observability Pipeline Is Also a Production System
The streaming issue was not the only failure mode.
The Collector also lacked sufficient memory backpressure. Under load, memory pressure could terminate the Collector and take unexported telemetry with it.
The export path also lacked adequate retry and buffering behavior, meaning a transient failure in the downstream analytics system could become permanent telemetry loss.
The remediation treated observability infrastructure the same way we would treat any other production service.
The problematic filtering rule was removed. A memory-limiting processor was introduced so ingestion could slow before resources were exhausted. Retry with exponential backoff and buffering was added to the exporter, and Collector resources were adjusted to better reflect observed traffic.
Treat telemetry as a production data pipeline
A simplified set of protections across the collection path.
That is an important shift in mindset.
Teams often invest heavily in making AI applications resilient while treating telemetry as passive plumbing.
But the telemetry layer has processors, queues, memory limits, network dependencies, exporters and failure modes of its own.
If observability matters to your business, the observability system itself needs observability.
05 Five Practices I Would Carry Into Any Agentic AI Platform
Trace the business transaction, not only the model call.
Start with the user's action and connect everything it triggers downstream.
Make attribution architectural.
Establish identity and tenant context at a trusted boundary rather than manually propagating it through dozens of call sites.
Design for streaming and asynchronous behavior.
Telemetry assumptions inherited from synchronous APIs can quietly fail when applied to LLM streaming and agent workflows.
Treat the Collector as production infrastructure.
Backpressure, memory protection, buffering, retries and health monitoring should be first-class concerns.
Reconcile telemetry against another source of truth.
Periodically compare observability data with gateway or provider usage. Otherwise, missing telemetry can look indistinguishable from lower consumption.
06 Token Counting Is Accounting. Tracing Is Causality.
AI interfaces are becoming simpler while the systems behind them are becoming more complex.
A user may see one chat box. Behind it may be dozens of model calls, embeddings, retrieval operations, agents, tools and hundreds of spans.
That makes aggregate token tracking necessary - but insufficient.
The operational questions enterprises increasingly need answered are not simply: How many tokens did we use?
They are: Who caused the usage? Which workflow produced it? Which models were invoked? What happened between the user's request and the final answer? And can we prove our telemetry captured the entire execution?
Token counters tell you what you spent.
Distributed traces tell you why.
And when your AI agent starts burning tokens, “why” is the question that actually helps you fix it.