Cesta has a strong Statistics and Data Visualization team. In this blog, we have utilized publicly available data from the National Health and Nutrition Examination Survey (NHANES) 2011–2016, available through the Centers for Disease Control and Prevention (CDC), to demonstrate our expertise in analytical methods using tools such as SAS, R, and Tableau.
Introduction
Creating reference intervals (RIs) for clinical laboratory tests is crucial in healthcare, as they support disease detection, monitoring, and treatment assessment. These intervals are typically determined using statistical methods based on test results from healthy individuals, aiming to capture the range within which most values fall for a given population.
This study aimed to investigate racial/ethnic and age-related differences in RIs for common biochemical and hematological laboratory tests using NHANES 2011–2016 data (N = 4,817) among individuals aged 18–40 years. A previous study by E. Lim et al. (2015) used NHANES 2011–2012 data (N = 3,077, aged 18–65). In our analysis, additional years of data were included to obtain more precise estimates of laboratory ranges.
The process of defining RIs often involves distribution-based methods such as normal or log-normal assumptions, or nonparametric approaches using percentiles (e.g., 2.5th and 97.5th percentiles).
Despite known disparities across racial and ethnic groups, comprehensive comparisons—particularly involving Asian populations—have been limited in the United States. Historically, Asians were grouped under “other” categories in NHANES. Their inclusion as a distinct group in more recent datasets provides an opportunity to assess differences in RIs across major racial/ethnic groups.
Methods
Data Source and Study Population
NHANES 2011–2016 data were used for this study. NHANES employs a multistage, stratified, cluster sampling design to generate a nationally representative sample of the civilian population. Data include surveys, physical examinations, and laboratory measurements.
Race/ethnicity was categorized as:
· Non-Hispanic White
· Non-Hispanic Black
· Hispanic (combined Mexican American and other Hispanic)
· Non-Hispanic Asian
The analysis included adults aged 18–40 years who reported their health status as “Excellent,” “Very Good,” or “Good.” Participants with missing or mixed race/ethnicity data were excluded due to small sample sizes.
Laboratory Tests
The following 16 biochemical and hematological tests were evaluated:
Albumin, basophils percent, bicarbonate, eosinophils percent, fasting glucose, hemoglobin, lymphocytes percent, mean cell hemoglobin, monocytes percent, platelet count, total bilirubin, total cholesterol, total calcium, triglycerides, and white blood cell count (WBC).
Unadjusted and unweighted lower and upper limits of normal ranges were calculated as the 2.5th and 97.5th percentiles, respectively, stratified by sex and race/ethnicity (Table 1).
Statistical Analysis
Quantile regression models were used to estimate the lower and upper limits of the normal range for each laboratory test. Analyses were stratified by sex and included race/ethnicity and age group (18–29, 30–40) as independent variables.
P-values were used to assess statistical significance, with p < 0.05 considered significant. Black race and age group 30–40 years were used as reference categories. All analyses were conducted using SAS 9.4.
Quantile regression was selected due to its robustness and ability to model distributional characteristics without relying on strict parametric assumptions.
Results
Reference Interval Comparisons
Table 1 presents unadjusted normal ranges for the 16 laboratory tests stratified by sex, race/ethnicity (Asian, Black, Hispanic, and White), and age group. These were compared with standard NHANES reference intervals.
Table 1: Normal Ranges of Clinical Laboratory Tests by Sex and Race
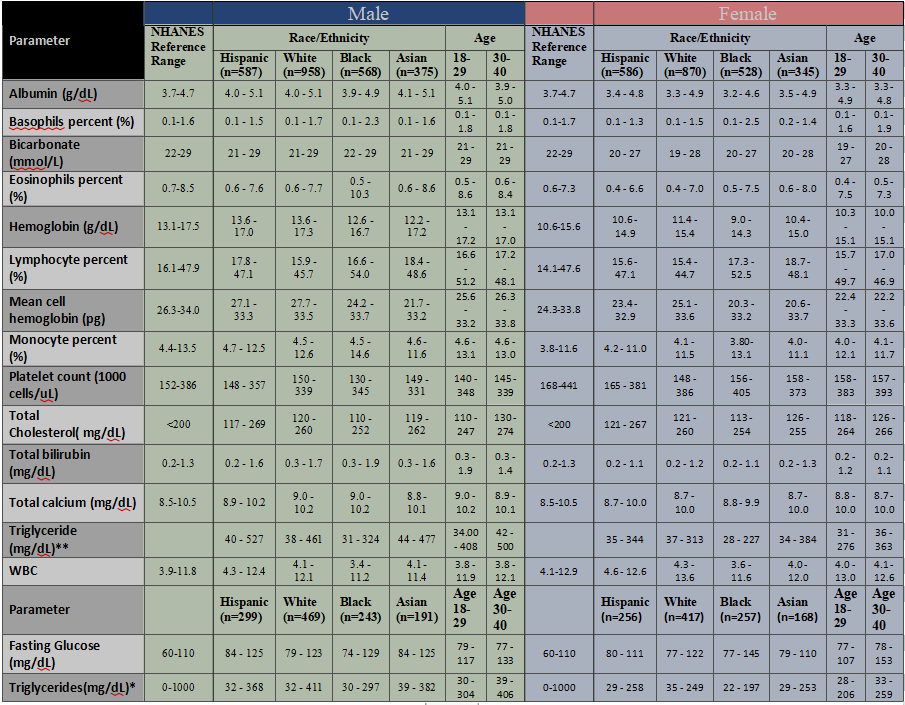
While many values were similar, several deviations were observed:
· Eosinophils (%): NHANES reference intervals are 0.7–8.5% for males and 0.6–7.3% for females. Observed ranges varied across groups (e.g., higher upper limits in Black males).
· Lymphocyte (%): Observed ranges differed from NHANES values, particularly among females across racial groups.
· Triglycerides: Substantial variation across racial/ethnic groups was observed in males.
· Creatinine: Lower normal ranges were observed in Asian females compared to White females.
Quantile Regression Findings
To assess whether these differences were statistically significant, quantile regression analyses were conducted (Table 2):
· All laboratory parameters showed significant differences across race/ethnicity or age group for either the lower or upper percentile
· The magnitude and direction of differences varied by parameter and sex
Table 2: Quantile regression P-value for Normal Ranges of Clinical Laboratory Tests for significance of race and age group by Sex
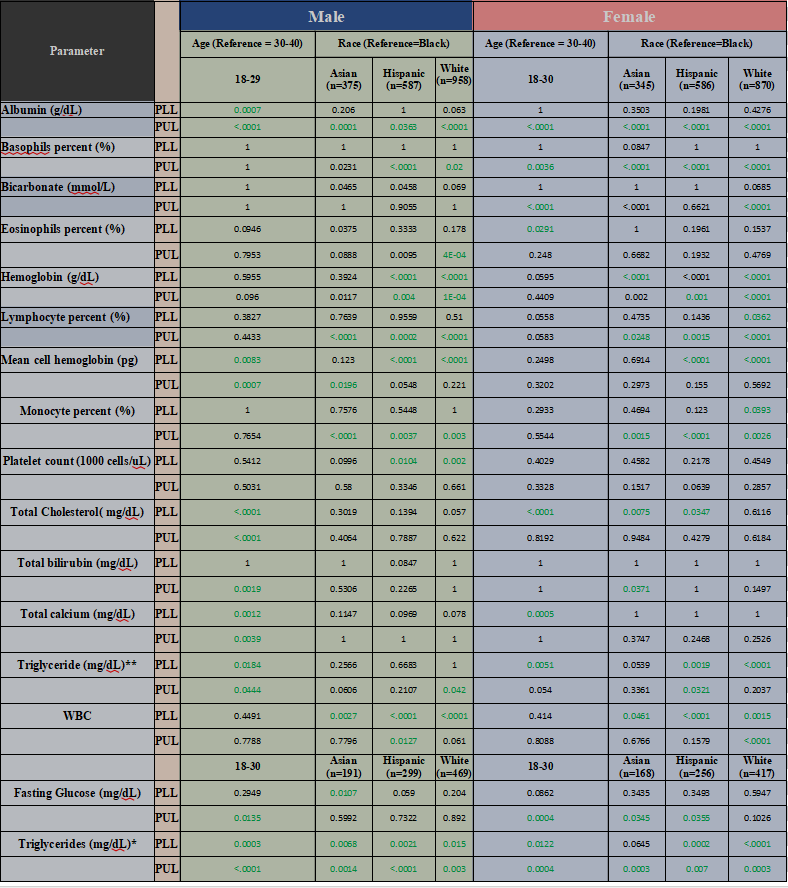
Significant age group differences (both percentiles) were observed for:
· Albumin
· Mean cell hemoglobin
· Total cholesterol
· Total calcium
· Triglycerides
· Fasting glucose
Visualization Insights
Figure 1 illustrates variations in normal ranges for selected laboratory tests by sex and race/ethnicity:
· Dashed lines represent NHANES reference intervals
· Horizontal lines represent estimated lower and upper limits for subpopulations
· Points indicate median values
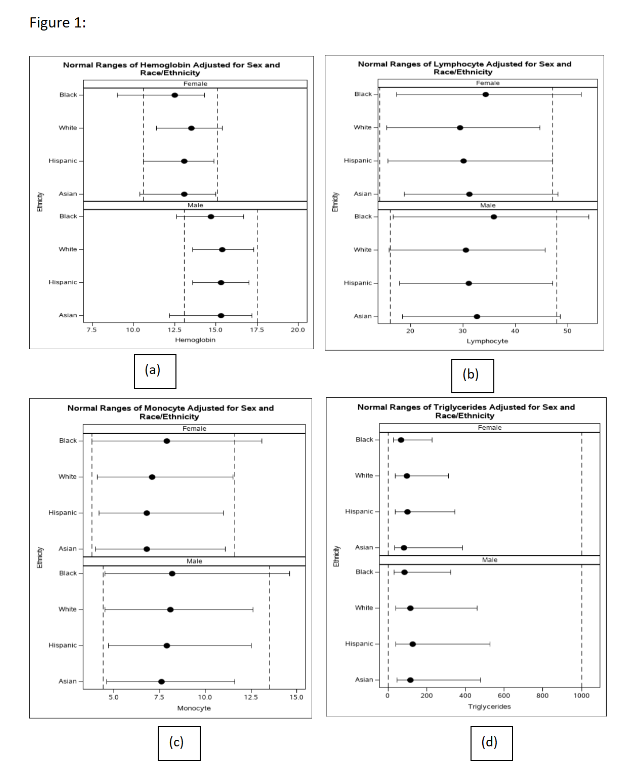
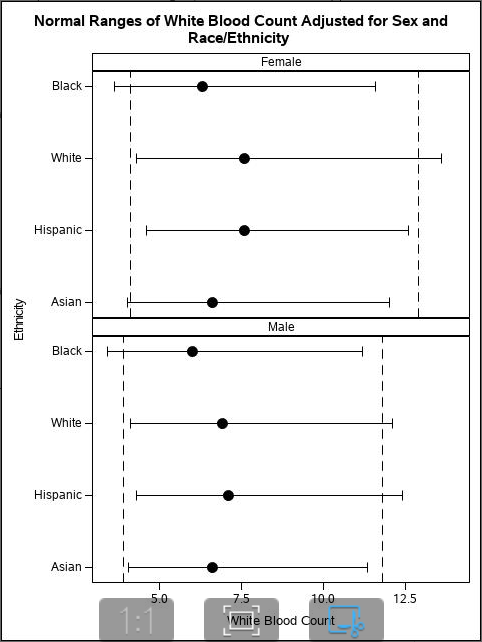
These visualizations highlight differences between population-specific ranges and standard reference intervals.
Discussion
These findings demonstrate the importance of developing accurate and representative reference intervals. Differences across racial/ethnic groups suggest that a single universal RI may not be appropriate for all populations.
Population-specific RIs may help:
· Reduce misdiagnosis
· Avoid over- or under-estimation of disease prevalence
· Improve identification of abnormal laboratory values
Healthcare providers rely on laboratory results for clinical decision-making, including disease screening, monitoring, and early detection. Therefore, accurate and representative RIs are essential for effective patient care.
Conclusion
In summary, different racial and ethnic groups may have different normal ranges for laboratory test results. However, these differences are not always reflected in standard reference intervals used in clinical practice.
Incorporating demographic-specific RIs has the potential to:
· Improve diagnostic accuracy
· Enhance clinical decision-making
· Support better health outcomes
Further research is needed to evaluate the clinical impact of implementing such tailored reference intervals in practice.
References
1. Lim E, Miyamura J, Chen JJ. Racial/Ethnic-Specific Reference Intervals for Common Laboratory Tests. Hawaii J Med Public Health. 2015.
2. Cheng CK-W et al. Complete blood count reference interval diagrams derived from NHANES III. Laboratory Hematology. 2004.
3. Liu X et al. Racial disparity in microalbuminuria and hypertension. ISRN Hypertension. 2013.